A Case Study from Garforth
This blog is based on a presentation from Eco-Friendly Garforth’s Energy Sustainability events from 2023. It describes the domestic set up from one of our members.
My Domestic System
My roof is made up of three groups of 330W solar panels: 3 facing south, 13 facing east and 4 facing west.

On reflection the installation of the west facing panels was probably an error as the roof is more north-west facing and so only really generates anything useful in the summer months. I should have had better advice!
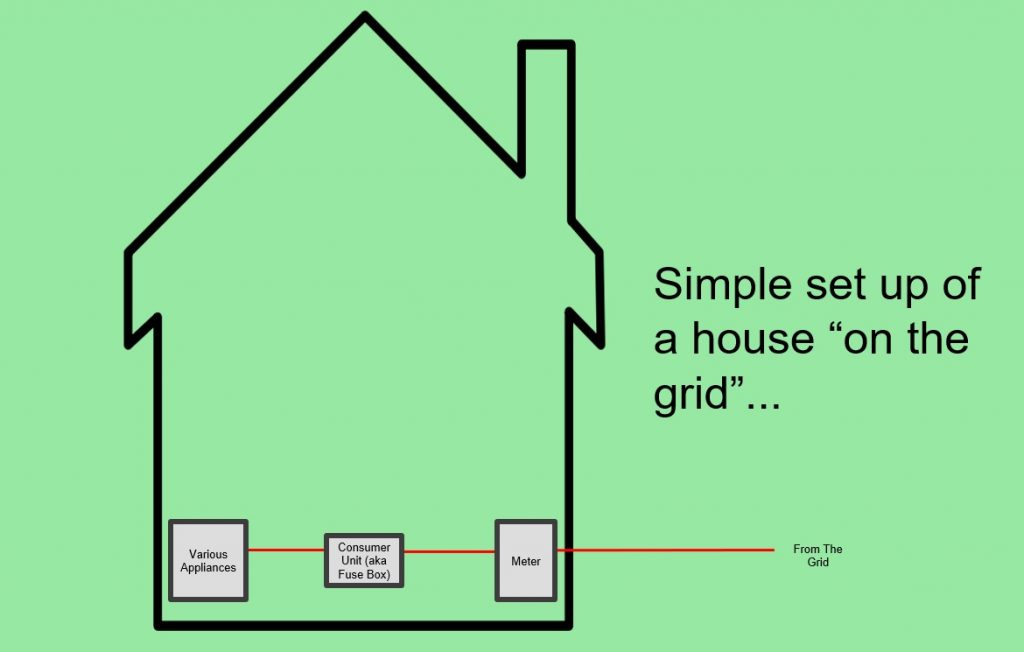
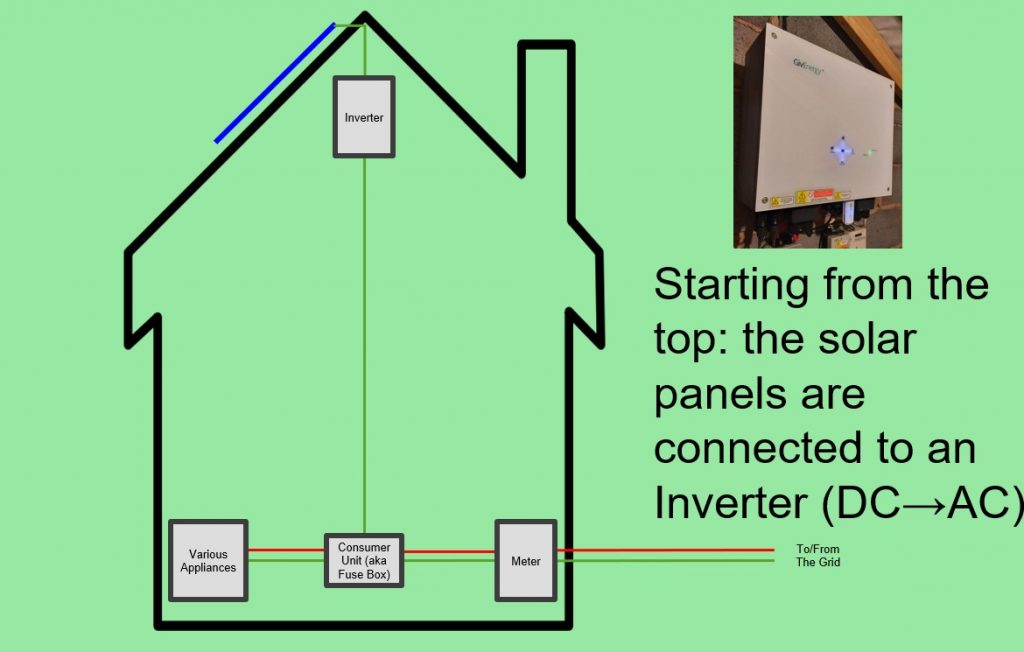
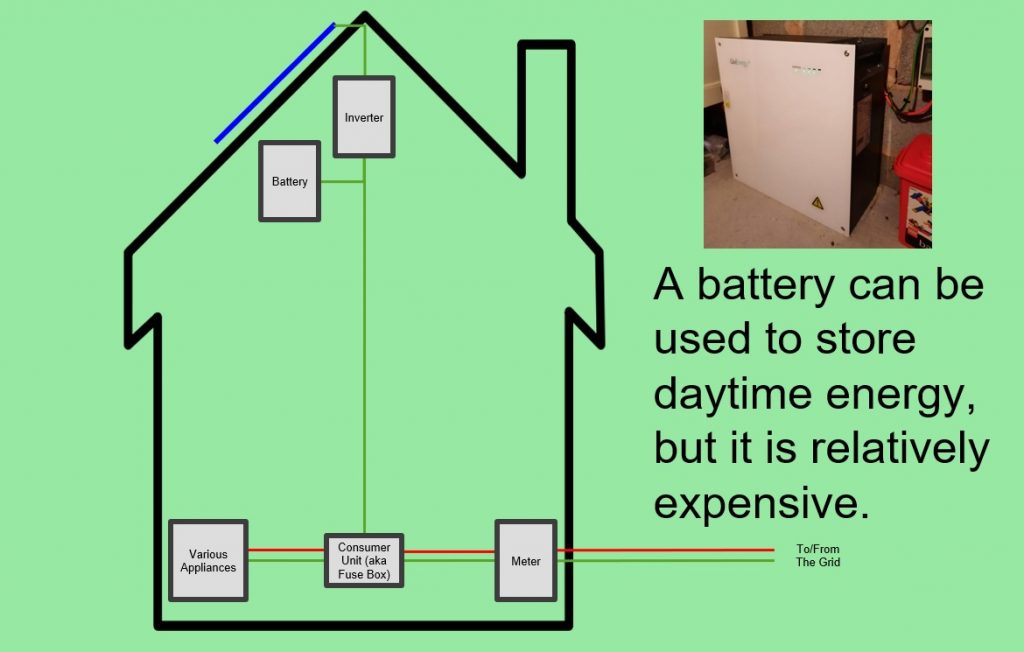
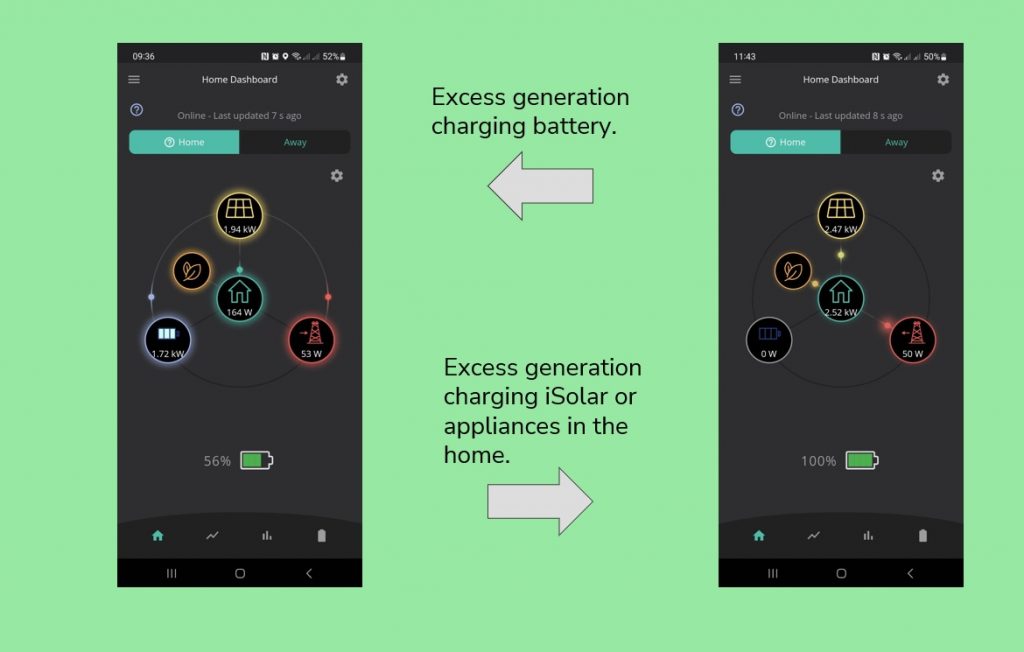
The images below build up a picture on how the solar works within the home starting with the simple connection to the national grid.
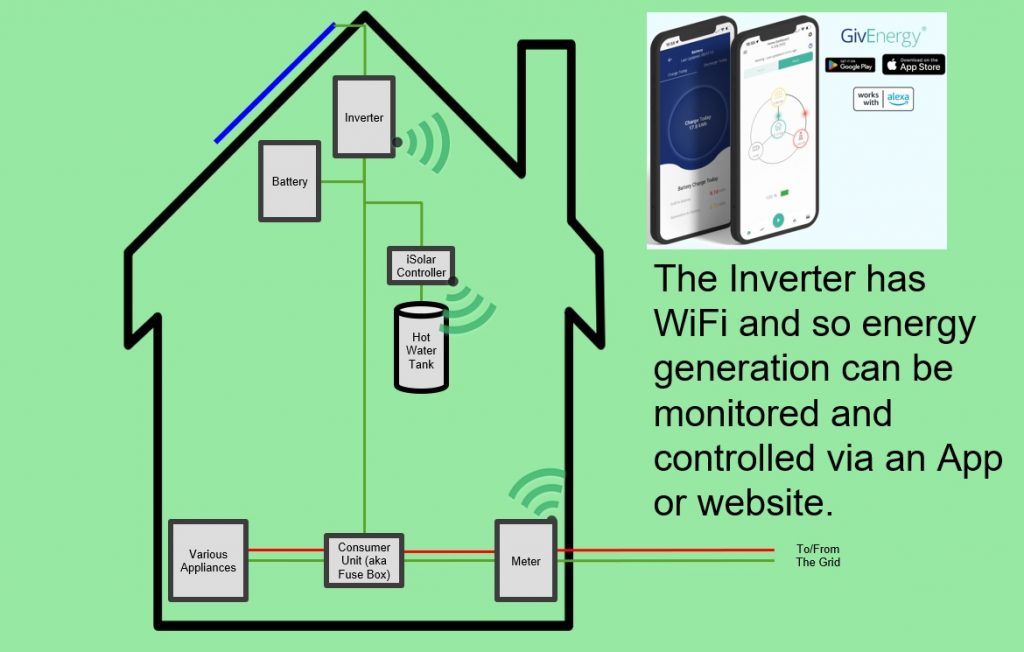
The solar set up shown above has been in place for a few years now and I’ve been able see the impact on my energy usage.

The graph above shows the daily electricity consumption for each month before the installation of solar and afterwards. The annual consumption dropped by over 1,200kWh and so saving between £384 and £592 per year (depending on level of UK Government Energy Price Guarantee) and preventing 236kg of CO2e from entering the atmosphere (based on the carbon intesity in 2022).
As exporting electricity only pays 15p/kWh the income was more modest at £288 per year. The biggest savings are made on the electricity you don’t need to import from the grid. That’s why it is important, when designing a solar panel system, to maximise the self-consumption and minimise exporting to the grid.
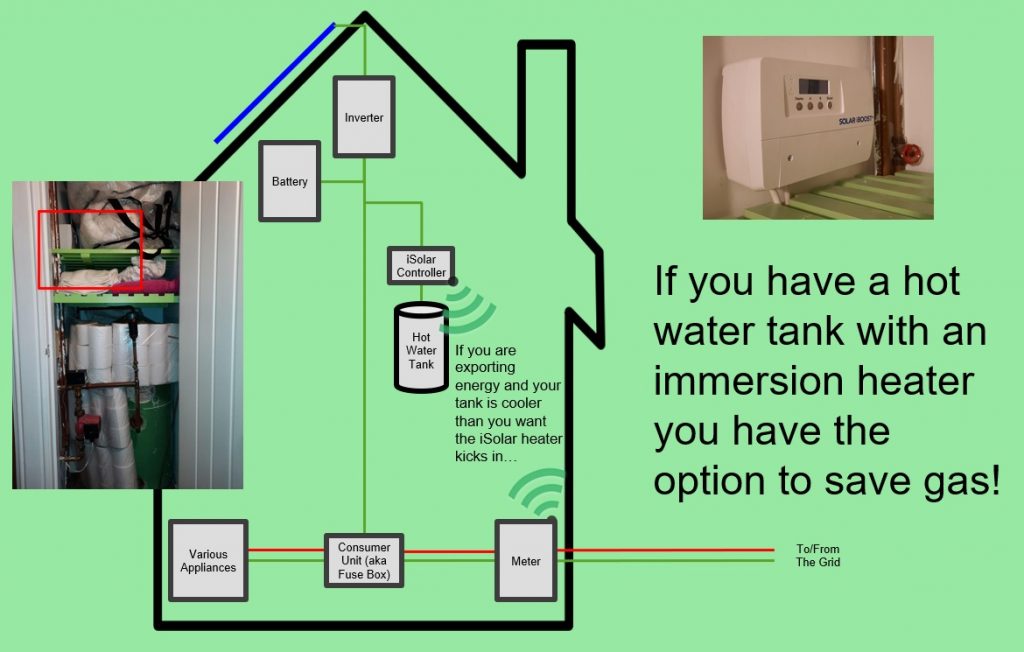
I was pleased with the impact on gas usage as excess electricity was not exported but used to heat the hot water tank using the immersion heater. The graph below shows the change in gas consumption.

The graph above shows the daily gas consumption for each month before the installation of solar and afterwards. The annual consumption dropped by over 3,700kWh (or 39%) and so saving between £367 and £606 per year (depending on level of UK Government Energy Price Guarantee) and preventing 686kg of CO2e from entering the atmosphere.
My figures suggest the payback period for the solar install will be in less than 8 years.
From a climate impact point of view we shouldn’t forget about “embodied” and “operational” carbon. Everything we make and use creates waste atmospheric carbon. Even things that are “green” have a payback period before they can be considered carbon negative.
There are lots of factors that play a part in this and is a big can of worms and not for this blog!
What if you don’t have solar?
You can still have a positive impact on reducing carbon emissions even if you don’t have a domestic solar installation. Ideally what you need to be able to do is to use electricity when the mix on the grid is as green as possible. Luckily there is an App called the “WhenToPlugIn” App. that can do this for you.

The WhenToPlugIn app shows you the live carbon intensity (a measure of CO2 emissions per unit of electricity consumed) forecast and lets you know when the electricity in your home will be cleanest over the next 48 hours to help you plan your electricity usage.
The app also offers a full breakdown of the energy sources powering the electricity in your region and provides live updates as new clean energy records are broken too!
Using timer features of modern appliances lets you run them overnight if that’s when the energy will be cleaner.